
The short answer: this Sri Lanka road accident dataset holds 4,314 accident records from 16 May 2018 to 10 September 2026, covering all 25 districts and 240 named places. Each record is paired with that day’s temperature, humidity and a weather code. It is useful for exploring trends, comparing districts and practising data analysis. It is not a complete official record. It captures roughly one in eight fatal crashes, its timestamps look like news publication times, and some of its death counts are national year-to-date totals rather than single crashes.
The most interesting result is a negative one. When every record was checked against independent daily rainfall for its district, days with a reported accident were no rainier than ordinary days in the same district and month. That does not prove rain is harmless on Sri Lankan roads. It shows that this dataset, as built, cannot measure the weather effect.
This guide explains what the dataset contains, what it shows, the problems to fix before you use it, and where to find better data for serious traffic-safety research.
The dataset at a glance
| Item | Value |
|---|---|
| Records (raw file) | 4,314 |
| Records after removing duplicates and one broken row | 4,294 |
| Date range | 16 May 2018 – 10 September 2026 |
| Days with at least one record | 2,078 of 3,040 days |
| Districts | All 25 |
| Named places (cities and towns) | 240 |
| Records with at least one death* | 53% |
| Weather fields | Weather code (0–3), max/min/mean temperature (°C), mean humidity (%), max wind gusts |
*Excludes 71 records whose death count is not a single-crash figure (explained below).
What each column means
The file has 19 columns. The meanings below come from the column names and from checking the values; the dataset itself does not come with a documented data dictionary.
| Column | What it holds | Notes |
|---|---|---|
id | Record number | Unique, but not in date order |
date, time | Date and time stamp | Behaves like the time a report was published, not the crash time |
year, month, day, hour, day_of_week | Parts of the date and time | Derived from date and time |
district | One of Sri Lanka’s 25 districts | Some records are assigned to the wrong district |
city | Town or city named in the report | ”Colombo” is used for 220 records, including some national stories |
latitude, longitude | Coordinates of the town | Town centre, not the crash site |
deaths_count | Number of deaths | Values above 25 are mostly national totals, not one crash |
weather_code | Weather category, 0–3 | Undocumented; behaves like a rain-intensity scale |
temp_max, temp_min, temp_mean | Daily temperatures in °C | Source not stated |
windgusts_max | Daily maximum wind gust | Zero in every valid record, so unusable |
humidity_mean | Daily mean relative humidity (%) | One missing value |
How complete is it?
Not very, and that matters for every conclusion you draw.
The Police Spokesman reported 2,287 fatal accidents in 2024 and 2,562 in 2025, with 2,388 and 2,710 deaths respectively (Daily Mirror, 1 January 2026). The dataset has 300 fatal records for 2024 and 320 for 2025. That is roughly 12–13% of fatal crashes, and an even smaller share of all crashes, because non-fatal accidents far outnumber fatal ones.
Coverage also changes from year to year:
| Year | Records | Fatal records | Days with records |
|---|---|---|---|
| 2018 (from 16 May) | 373 | 208 | 185 |
| 2019 | 590 | 339 | 285 |
| 2020 | 368 | 183 | 205 |
| 2021 | 215 | 75 | 140 |
| 2022 | 329 | 184 | 189 |
| 2023 | 532 | 305 | 272 |
| 2024 | 626 | 300 | 295 |
| 2025 | 713 | 320 | 292 |
| 2026 (to 10 Sep) | 548 | 323 | 215 |
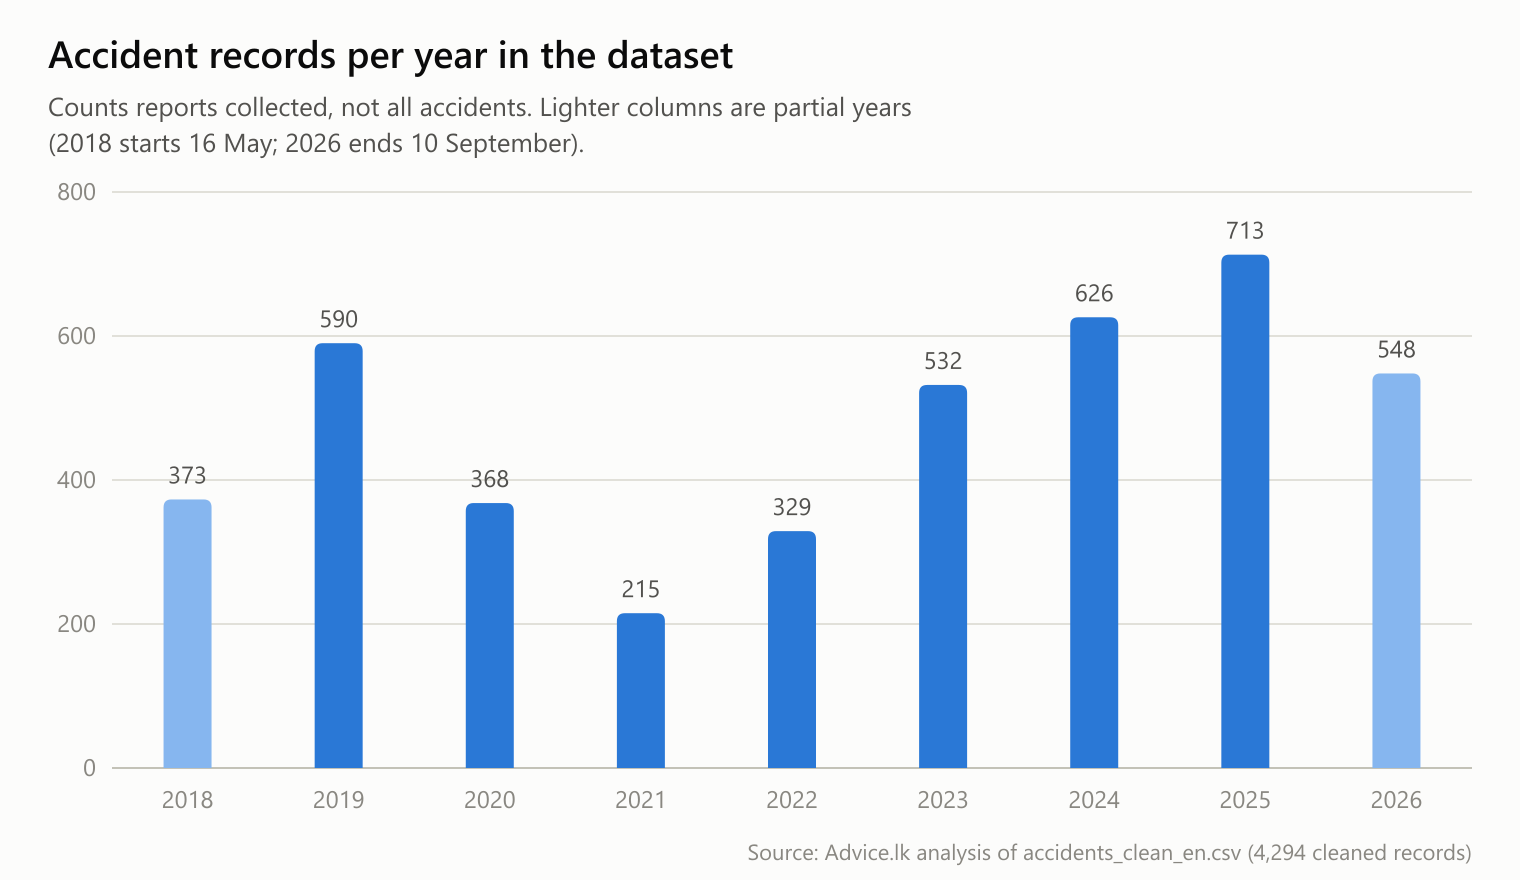
The dip in 2020–2021 lines up with the COVID-19 period, when travel restrictions reduced traffic. The dataset’s largest gaps also fall in 2021, including 21 days with no records between 21 September and 13 October 2021. There is also a 25-day gap from 7 to 31 December 2022.
Do not read the rise from 2021 to 2025 as a rise in accidents. The number of records reflects how many reports were collected. Use the official police totals for national trends.
Problems to fix before you analyse it
1. Some death counts are national totals
Seventy-one records have more than 25 deaths, and 10 of them have more than 1,000. No single road crash in Sri Lanka kills a thousand people. These values are cumulative national figures quoted in news reports and attached to one town.
For example, one record dated 7 July 2025 lists 1,351 deaths at Puliyankulam in Vavuniya. Police statistics reported that 1,351 people died on Sri Lankan roads from 1 January to 30 June 2025 (Daily Mirror, 14 July 2025). The record is a half-year national total, not a crash.
Summing deaths_count without cleaning gives 28,334 deaths, a figure that is meaningless. Without the 71 high values, the total is 5,492. Flag or remove high values before any severity analysis. This guide uses 25 as the cut-off, because Sri Lanka’s worst recent bus crashes killed around 15 to 22 people. Some records between 11 and 25 deaths may still be weekend or holiday totals, so check them individually if severity matters to your work.
2. Some locations are wrong
Two of the deadliest crashes of 2025 appear in the dataset under the wrong district:
- The Kotmale (Garandi Ella) bus crash on 11 May 2025, on the Nuwara Eliya–Gampola road, killed 21 to 22 people (Newsfirst). The only 21-death record that day is placed at Paranthan in Jaffna District.
- The Ella–Wellawaya bus crash on the night of 4 September 2025 killed 15 people in Badulla District (Newsfirst). The only 15-death record is dated 5 September and placed at Nilaveli in Trincomalee District.
The matching death counts and dates make these almost certainly the same events. Wrong locations matter twice. They distort district comparisons, and they attach the wrong district’s weather to the record.
3. Times are report times, not crash times
Only 19 of 4,294 records (0.4%) have a time between midnight and 6 am, and most fall between 6 am and 6 pm, which matches a newsroom’s working day. Timestamps with seconds (for example, 19:22:33) also look like publication times. The Ella crash, which happened around 9 pm on 4 September, carries the next day’s date.
Treat hour and time as the time the news reported an accident. For the date, allow for a one-day lag.
4. Duplicates and a broken row
Nineteen records are exact copies of other records apart from their id. One record (id 2551, Neluwa, 1 July 2022) has its weather values shifted one column to the right. That gives it a weather code of 25.24 and a wind gust of 78.41, with humidity missing. Remove both before analysis.
5. The wind column is empty
windgusts_max is zero in every valid record. Drop it. If wind matters to your question, join wind data from another source.
6. The weather source is not documented
The temperature and humidity values only loosely track an independent reanalysis. Correlation with Open-Meteo’s daily maximum temperature for the same district and date is 0.33. For humidity it is 0.38. Part of that gap comes from comparing town coordinates with district centres, but you should still treat the weather fields as approximate.
What the dataset shows about trends
Districts
Colombo has the most records by a wide margin. This partly reflects population and traffic, and partly the habit of tagging national stories to Colombo.
| District | Records | Share of all records | Share with a death |
|---|---|---|---|
| Colombo | 574 | 13.4% | 40% |
| Kurunegala | 256 | 6.0% | 59% |
| Gampaha | 251 | 5.8% | 61% |
| Galle | 224 | 5.2% | 55% |
| Badulla | 215 | 5.0% | 48% |
| Kalutara | 204 | 4.8% | 55% |
| Nuwara Eliya | 198 | 4.6% | 39% |
| Matale | 196 | 4.6% | 59% |
| Anuradhapura | 194 | 4.5% | 64% |
| Puttalam | 185 | 4.3% | 51% |
The fewest records come from Kilinochchi (48), Mannar (66), Mullaitivu (83), Batticaloa (85) and Vavuniya (84).
The “share with a death” column describes which accidents got reported, not how dangerous each district’s roads are. A minor crash in Colombo is more likely to reach the news than a minor crash in Anuradhapura. Comparing district risk properly needs population, vehicle numbers or traffic volume, and none of these are in the file.
Months and seasons
Across the full years 2019–2025, January had the largest share of records (9.9%), followed by September (9.6%), June (9.5%) and December (9.4%). April (6.4%) and May (6.0%) had the smallest. The month-to-month differences are modest and may reflect news coverage as much as road conditions.
Days of the week
Monday (696) and Sunday (682) have the most records, and Tuesday (528) the fewest. Because the dates look like publication dates, part of the Monday peak is likely weekend crashes reported on Monday. Do not treat this as evidence that Monday is the most dangerous day to drive.
Weather and accidents: what the data can and cannot show
What the weather code appears to mean
The dataset does not define weather_code. To test it, each record was matched to daily rainfall from Open-Meteo’s historical weather API at the centre of its district. The codes line up with rain intensity:
| Weather code | Share of records | Median rainfall that day (Open-Meteo) | Days with 1 mm or more |
|---|---|---|---|
| 0 | 15.9% | 0.3 mm | 34% |
| 1 | 57.5% | 2.1 mm | 66% |
| 2 | 21.8% | 6.6 mm | 89% |
| 3 | 4.8% | 14.8 mm | 95% |
Humidity in the dataset rises in step, from a mean of 78% for code 0 to 88% for code 3. The most reasonable reading is that 0 means dry and 3 means heavy rain. That is an inference, not a documented definition.
Why counting accidents by weather is misleading
A common first chart shows that most accidents happened in “code 1” weather. That only tells you most days in Sri Lanka are code 1 days. To ask whether rain raises accident risk, you need to compare accident days with all days in the same place and season. This dataset contains only days with a reported accident, so it has no built-in baseline.
The check: accident days versus ordinary days
To build a baseline, daily Open-Meteo rainfall was downloaded for each district from May 2018 to September 2026. Each accident record was compared with every day in the same district and the same month. This controls for the fact that the wet zone is wetter and that monsoon months are wetter.
| Rain threshold | Accident-report days with this much rain | Expected from all days (same district and month) | Ratio |
|---|---|---|---|
| 1 mm or more | 67.6% | 67.0% | 1.01 (95% CI 0.99–1.03) |
| 10 mm or more | 21.2% | 21.3% | 0.99 (95% CI 0.94–1.04) |
| 25 mm or more | 5.3% | 5.5% | 0.97 (95% CI 0.86–1.09) |
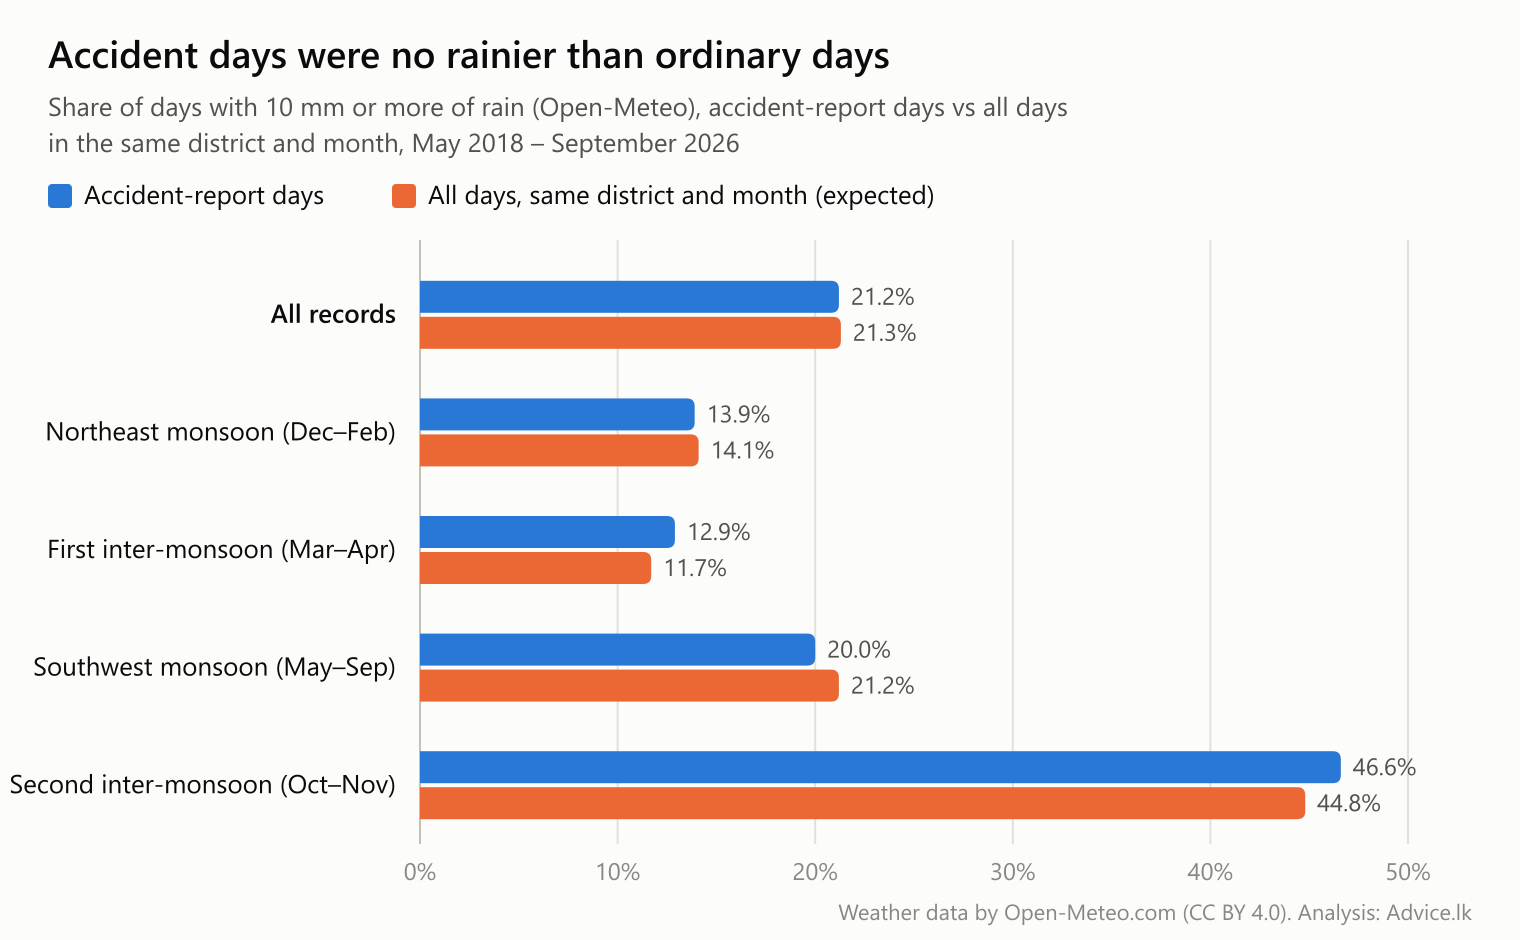
A ratio of 1 means accident-report days were exactly as rainy as typical days. All three ratios sit close to 1, and the confidence intervals include 1. Using the previous day’s rainfall, to allow for the publication lag, gives the same picture: 20.6% of records follow a day with 10 mm or more.
The pattern holds across Sri Lanka’s monsoon seasons. The month windows below are the usual approximate ones; see the guide to Sri Lanka’s climatic zones and floods for how the seasons affect each region.
| Season (approximate months) | Records | Days with 10 mm+ rain: accident days | Expected |
|---|---|---|---|
| Northeast monsoon (Dec–Feb) | 1,128 | 13.9% | 14.1% |
| First inter-monsoon (Mar–Apr) | 644 | 12.9% | 11.7% |
| Southwest monsoon (May–Sep) | 1,897 | 20.0% | 21.2% |
| Second inter-monsoon (Oct–Nov) | 625 | 46.6% | 44.8% |
Rain also did not make a reported accident more likely to be fatal:
| Rainfall that day (Open-Meteo) | Records | Share with a death |
|---|---|---|
| Under 1 mm | 1,366 | 55.6% |
| 1–10 mm | 1,969 | 51.9% |
| 10–25 mm | 668 | 51.0% |
| 25 mm or more | 220 | 52.3% |
How to read this result
The honest conclusion is that this dataset shows no detectable link between daily rainfall and reported road accidents. It does not show that rain is safe. Several features of the data could hide a real effect:
- The records are a news sample. Which crashes get reported depends on severity, location and the news cycle, not just on what happened on the road.
- Some locations and dates are wrong, so some records carry another district’s or another day’s weather.
- Daily totals blur timing. A crash at 8 am and a storm at 4 pm share the same daily rainfall figure.
- District-centre weather is coarse. Rain in Ratnapura District can differ sharply between the hills and the lowlands.
- Behaviour changes in rain. Fewer trips and slower driving on wet days can offset a higher crash risk per kilometre. Without traffic volumes, the two effects cannot be separated.
Testing the weather effect properly needs police records with exact crash times and locations, hourly rainfall, and some measure of traffic.
Can you use it to build an accident prediction model?
For learning and prototyping, yes, with clear limits. For decisions about enforcement, road design or insurance, no.
What works:
- A severity model (fatal versus non-fatal) using district, month, day of week and weather, after removing the aggregate death counts. Expect weak performance; the analysis above found little signal in weather.
- A district-day count model. Build a full calendar of every district and every day, set days without records to zero, and join weather from Open-Meteo. This gives you the negative examples the raw file lacks. Understand that the target is “reported accidents”, which mixes road risk with news coverage.
Practical tips:
- Split training and test data by time (for example, train on 2018–2024 and test on 2025–2026) rather than at random, so the model is not evaluated on days it has partly seen.
- Do not use
houras a crash-time feature. - Exclude 2020–2021, or flag it, because coverage and traffic were unusual.
- Check model results district by district. A model that only learns “Colombo has more records” is not useful.
Better sources for traffic-safety research
If your work needs accurate counts or causes, start with official data and use this dataset only as a supplement.
- Sri Lanka Police: the official keeper of road accident records. Recent totals are mostly released through the Police Spokesman and reported in the press. Detailed records generally need a formal request.
- Open Data Portal (data.gov.lk) – transport: has some police road accident files in CSV and Excel. Check the year each file covers before you rely on it.
- Department of Census and Statistics National Data Archive: historical police road accident microdata, with documentation on how stations recorded accidents.
- Department of Meteorology: official observations and seasonal outlooks.
- Open-Meteo historical weather API: free reanalysis-based daily and hourly weather for any coordinate, used for the checks in this guide.
How this analysis was done
- Source file:
accidents_clean_en.csvwith 4,314 records. The original publisher and collection method are not documented. - Cleaning: removed 1 malformed record and 19 duplicates, leaving 4,294. Flagged 71 records with more than 25 deaths as likely aggregates and excluded them from death-based figures.
- Weather check: daily rainfall from Open-Meteo’s historical weather API at the median coordinates of each district’s records, for May 2018 to September 2026. Expected rain shares are averages over all days in the same district and calendar month. Confidence intervals come from 2,000 bootstrap resamples. Weather data by Open-Meteo.com under CC BY 4.0.
- Date of analysis: 8 October 2026. Official accident totals are as reported in the cited articles.